Baron Fourier (1768-1830):
Any continuous periodic signal can be represented as the sum of
carefully chosen sine waves.
The Fourier Transform is used to express a function as a continuous integral of sine waves. The Fourier Series (or Discrete Fourier Transform) is used to express a discretely sampled periodic function as a discrete sum of sine waves.
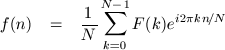
The DFT:
and its inverse: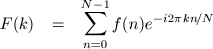
An input series, f, of N real values fed through the forward DFT will produce an output series, F, of N/2 complex values. Obviously, the highest frequency that can be represented without aliasing given any sampling rate, R, is R/2 Hz. One-zero-one-zero at 44100Hz is a square wave with a frequency of 22050Hz. This lower frequency is called the Nyquist limit or Nyquist frequency.
The first sample of the transformed series, F0, is the DC component (the average) of the input series.
                N = number of samples
                R = sampling rate (samples per second)
              R/2 = Nyquist frequency (Hz)
              N/R = duration (seconds)
           |F[0]| = DC component
          Re F[n] = n-th real output
          Im F[n] = n-th imaginary output
            n*R/N = frequency (in Hz) corresponding to n-th output
           |F[n]| = amplitude of n*R/N Hz frequency
         Arg F[n] = phase of n*R/N Hz frequency
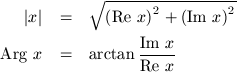
The complex output of a DFT is a polar representation of the present frequencies. The amplitude of any given frequency is the modulus of the corresponding complex output; the phase is the angle of the complex output:
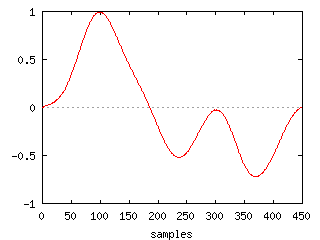
nf kindly provided a 48Khz sample of him plucking the A string on his steel electric guitar. Here's a single period taken from it:
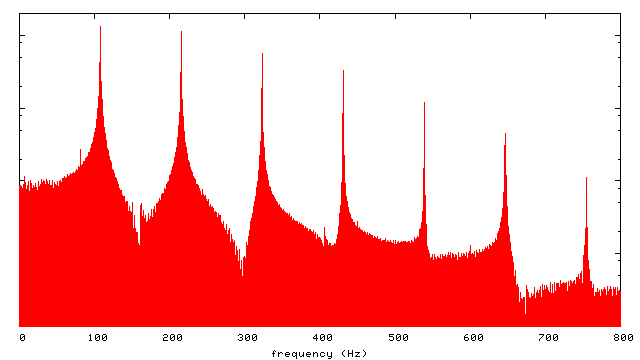
To get enough frequency resolution, I took a little more than two seconds worth of samples and ran them through a DFT (example code: dft.c - slow):
The most prominent frequency is at 107 point something Hz. The frequency of a perfectly tuned A-2 is 110Hz. The spectrum also shows diminishing overtones at integer multiples of the base frequency.
Graphs by gnuplot.