First written 2017-04-22.
This is a followup to benchmarking with RDTSCP about measuring how CPUs overclock and underclock themselves, and how to control for it in benchmarks.
I'm (still, 2017) using an i7-2600K Sandybridge, but this probably applies to a bunch of older and newer CPUs as well.
While running a benchmark I noticed that, if I ran enough iterations, there was a step down in how long the code took to run. It looked something like this:
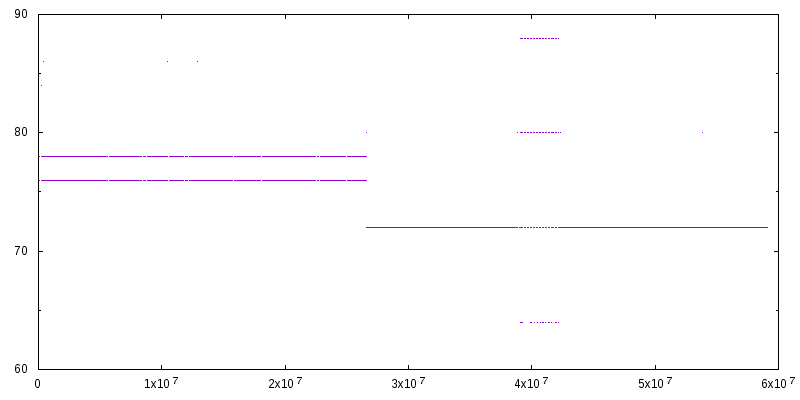
On the above graph, the horizontal axis is the time at which the measurement was taken, relative to the start of the experiment, measured in TSC units. On my CPU, there are about 3.4 billion (3.4 x 10⁹) TSC units per second of real time.
The vertical axis is how long one iteration took, also in TSC units. In this case, I'm measuring the difference between two back-to-back RDTSCP calls.
At first, I tried to control for the step change in results by discarding early measurements, but I didn't discard nearly enough. It turns out there are a bunch more steps and that it takes about a third of a second for the results to stabilize:
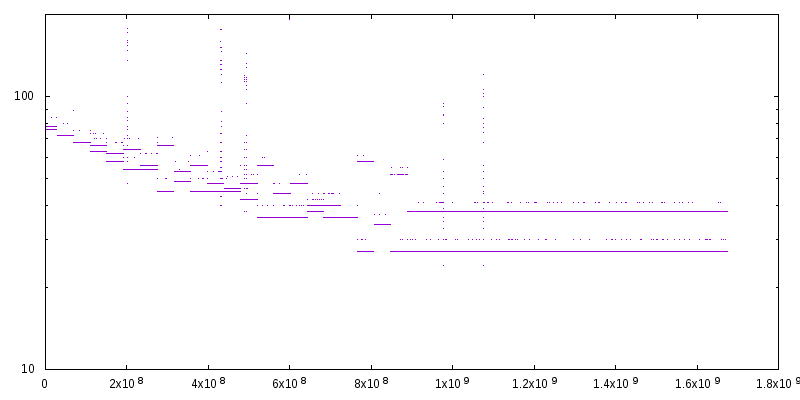
This curve shows the CPU moving through a set of sleep / powersave states where it's underclocking itself by different amounts. I was surprised by how many and fine-grained the steps are.
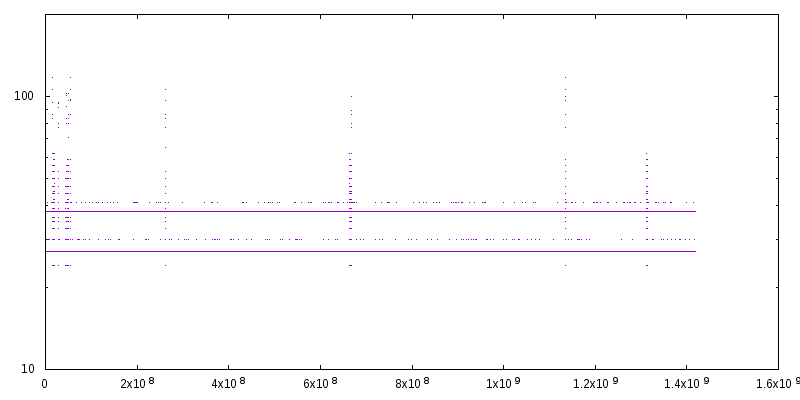
A simple way to avoid this behaviour is to spin one of the cores. I like to run:
perl -e 'while(1){}'
Or, if you prefer shell:
while :; do :; done
This gives the following graph:
Now the problem is overclocking: the benchmark is oscillating between two different measurements because TurboBoost is active, but not consistently. On Linux, it can be disabled with:
echo 1 | sudo tee /sys/devices/system/cpu/intel_pstate/no_turbo
Which gives a more stable result:
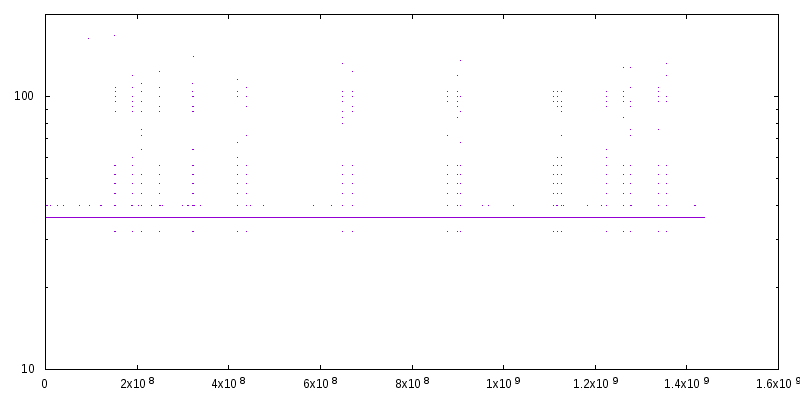
Of course, nothing is ever simple, so we've gone from two lines at 27 and 38, to a single line at 36.
The code I used to take measurements: rdtsc.cc